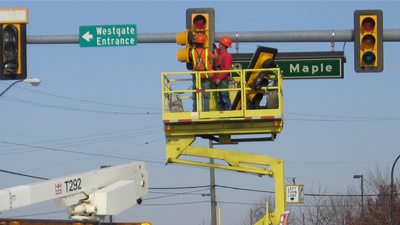
City staff have prepared these interactive reports/dashboards/maps to provide the Transportation Commission and the public with an understanding of the City’s crash history, crash trends, and high injury network. This reporting was developed by Transportation staff and is intended to inform policy recommendations.
To enable users to interact with and analyze the data, we have presented the crash datasets in three different ways:
- Frequency and trend analysis
- Geospatial patterns
- High Injury Network
Crash Types and Frequencies
Analysis of crash types and frequencies can be found on the A2 Analytics Traffic Crashes Dashboard.
Spatial Analysis
Geospatial analysis of traffic crash density can be found on Map Ann Arbor's Traffic Crash Map. Use the controls on the right side of the map to toggle between the layer choices and the legend.
High Injury Network
Every two years, the City updates its High Injury Network—a map highlighting corridors and intersections with the most serious crashes. This work supports the Moving Together Transportation Plan goal of focusing transportation investments where safety needs are greatest.
The transportation and engineering team uses this data to guide designs that address crash patterns. Think of this evaluation as a way to identify the locations in Ann Arbor with the most significant safety concerns.
Two map layers will be available: one showing the 2021 tiered locations and another for the updated 2024 locations.
View the Tiered Corridors and Intersections
Additional Resources
Regional – SEMCOG Crash Analysis
State – Michigan Traffic Crash Facts
Federal – National Highway Traffic Safety Administration
Questions and comments? Please contact Cynthia Redinger, Transportation Engineer, at CRedinger@a2gov.org.
Fourth floor, 301 E. Huron Street, Ann Arbor, MI 48107
Cynthia Redinger
 734.794.6410 x43632
Connect with Us


