Expenditure Highlights
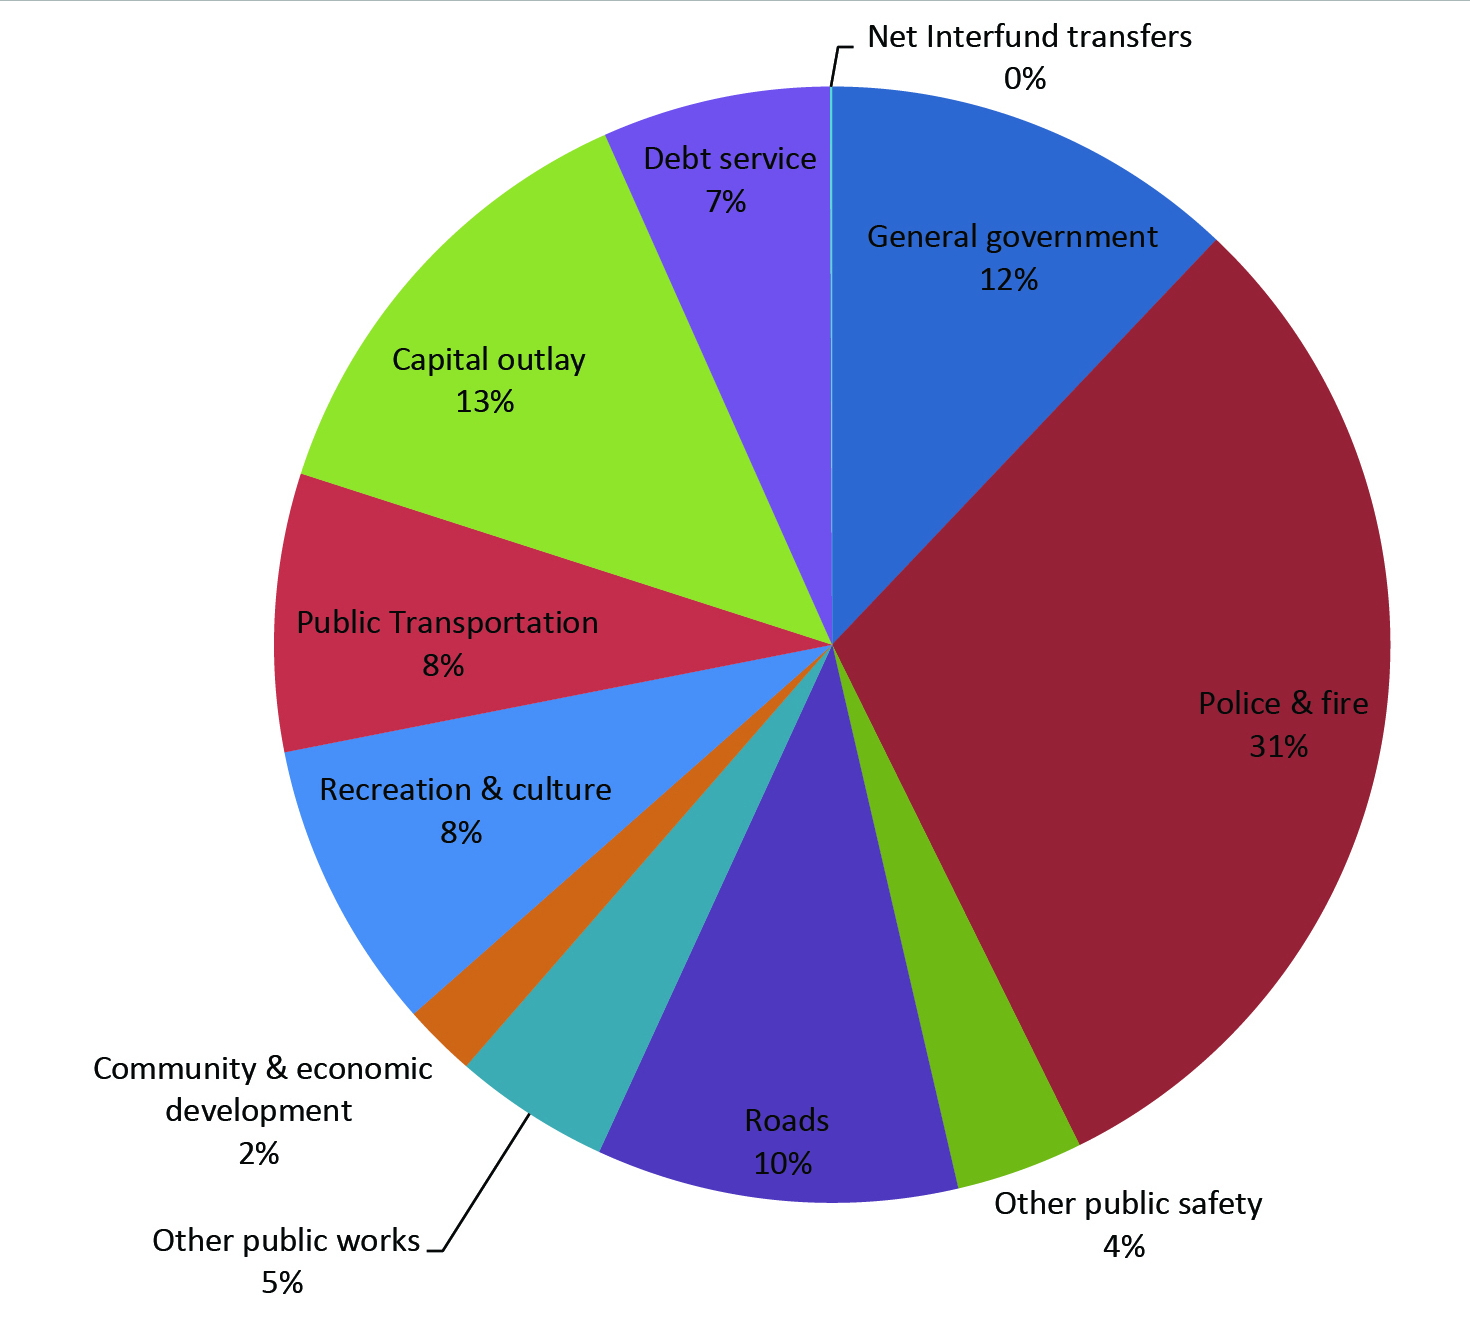
Below is a chart representing how the City spent its budget for fiscal year 2017 for governmental funds (General, Special Revenue, Debt Service, Capital Projects, and Permanent funds). Safety Service-related areas continue to be the largest use of our resources. The categories are defined as follows:
General Government- This represents service units such as Mayor & Council, City Administration, City Clerk, District Court, City Attorney, Finance, Human Resources and other administrative costs.
Police & Fire- This represents service units for Police and Fire.
Other Public Safety- This represents the Planning & Development service unit expenditures related to building inspections.
Roads- This represents the expenditures related to road construction, repair and maintenance.
Other public works- This represents costs associated with facility management, street lighting, hydropower operations, and customer service related to General Fund collection activities.
Public Transportation- This represents the transfer to the Ann Arbor Transportation Authority.
Community & Economic Development- This represents the human services funding as well as federal grant funding for community development. Costs associated with the economic development fund are also shown here.
Recreation & Culture- This represents the expenditures associated with recreation facilities and administration of park programs. The Historic District Commission expenditures are also shown here.
Capital Outlay - This represents capital outlay including projects for which the City issued a bond (i.e. Courts/Police building or the DDA Fifth Avenue parking structure).
Debt Service- This represents the cost of principal and interest paid on the City's general obligation debt.
Net Interfund Transfers- This represents activities between the funds.
This chart outlines the changes to expenditure per capita in each category of expenditure: